When Exactly Should I Irrigate?
This is a question that bedevils most growers, since the consequences of not irrigating at the correct time can lead to reduced growth (if irrigations are not timed to replace daily plant water use) or nutrient leaching and perhaps increased root disease, if irrigations are too frequent or too long.
Knowing exactly when to irrigate provides the opportunity for real increases in crop growth and quality and reductions in water and fertilizer costs. But it’s also a question that has its “roots” in some basic scientific principles. It requires some knowledge of the characteristics of the soilless substrate you use, which are also influenced by other factors (such as total rooting volume and substrate bulk density).
Water Basics
But let’s focus on the basics with an example. Imagine a standard container (8-inch diameter pot, approximately 1-gallon volume), filled with a peat-based substrate. We all know that different types of soilless substrates (or media) actually hold different amounts of water after a container is waterd to saturation. After 10 to 15 minutes, the substrate will reach “container capacity” and no further water will drain from the pot. Soil scientists call this “field capacity,” but it typically takes a few hours for a soil to reach this point.
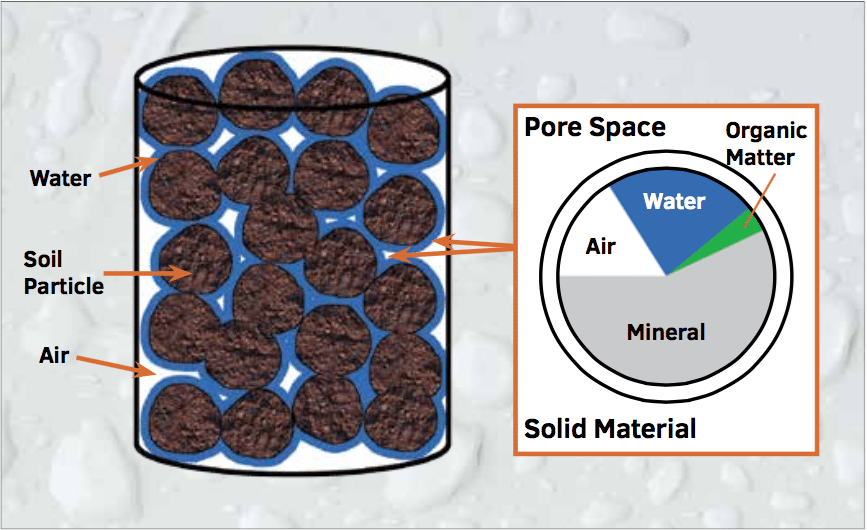
You can aslo think of container capacity as the ratio of water to air and solid particles, as illustrated at right. Soil (or substrate) particles have spaces between them of varying sizes which either hold water (due to the attraction of water to substrate particles and surface tension) or air, depending on the size of the pore space. This is also affected by the bulk density of the substrate, largely determined by how a pot is filled at planting.
The article “Soil Water Management” by Martin et al. gives more of the scientific background on soil water potential and how soil type affects plant available water. These principles are much the same for soilless substrates — but typically there is much less available water in most substrates. Total available water is also constrained by the total rooting volume of the container. So to avoid water stress, plants in containers require frequent irrigations, typically at least once or several times a day.

Additionally, different substrates are made up of different parent materials and have varying ranges of particle sizes. These all contribute to a relatively unique water-holding capacity for each substrate, much like a clay loam soil is going to hold more water than a sandy soil. This is also affected by the height of the container, but this has a relatively minor effects impact compared to the actual type of substrate in the container.
Using Sensors
For those of you familiar with some of our sensor irrigation research (see www.smart- farms.net), we are using moisture sensors to measure the change in the substrate water content over time. But sticking a sensor in a container doesn’t really give you an idea of the optimal range of substrate moisture that will avoid plant water stress. But if you have a sensor in your 8-inch pot, you can measure your volumetric water content (% VWC) at container capacity, just by saturating the container and letting it drain.
We advise pushing the entire sensor (including the head of the sensor) into the rootball through the side of the pot, by just cutting a small vertical slit half way down the container. Placing the sensor halfway down the height of the pot gives a good average soil moisture reading in the root ball, which minimizes the influence of gravitation on soil moisture. Let’s say this value is 30 percent VWC at container capacity for your substrate.
Precise Calculation is Key
Calculating exactly when to water requires a little more work. But this can be calculated quickly and easily.
It’s handy to have a few sacrificial plants to do this. Preferable a plant species that you grow a lot of, and you are perhaps are attuned to — either because they tend to wilt before other plants — or you can pick up subtle signs of water stress by observation (like a change in leaf reflectance due to flagging leaf hairs). If you can visually correlate these subtle signs of plant water stress with substrate VWC, then you have a measure of the total plant available water (the amount of water that is available to plants in that specific substrate).


Once you have saturated your pot with a sensor in it, all you have to do is not water the plant for a few days, and observe the plant for any subtle changes in water stress. You can make this more quantitative by actually weighing the pot twice a day and calculating the water loss each day. If you measure a few plants at the same time, that will give you a better average, since one plant may have larger canopy than another. Remember that 1 gram = 1 ml of water. If you also note the soil VWC at each time, you can then correlate the total ml water lost with your sensor VWC readings. When the plant shows visible signs of water stress, note the total water loss and VWC. Let’s say that the VWC when the plant is stressed is 20 percent. Since we don’t want to allow our crops to get water stressed, use half of the change in water content i.e. (30-20 = 10/2) = 5 percent + 20 percent as your set-point for irrigation events.
Figure 2 illustrates this for a Goldenrod (solidago) crop, as an example. What is interesting to see is that although the set-point value of 25 percent VWC is fixed, the time between irrigations varies, according to daily environmental conditions (mainly light and vapor pressure deficit). The plant water uptake can also be clearly seen, particularly at the 4-inch depth (black sensor line).
By following this procedure and adjusting the duration (cycle length) and frequency of irrigations, we have been able to achieve between 40 and 70 percent water savings and up to 50 percent reductions in nutrient loss for a variety of crops. We now also have the ability to completely automate irrigation events using sensor-based control with the new PlantPoint irrigation management system (Decagon Devices) and advanced pulse-irrigation Sensorweb software (Mayim, LLC). Many of our group’s previous articles and impacts can also be accessed from the smart-farms website at www.smart-farms.net/ publications.

 Video Library

Latest News
AAS,NGB 2024 Summer Summit this June
Brandt adds to leadership team