A New Way to Measure Electrical Conductivity
Todd Cavins, Brian Whipker and Bill Fonteno wrote an article on comparing substrate tests in 2001 (www.gpnmag.com/article/comparing-substrate-tests), which I would encourage you to read as a background to this article. Diane Camberato, Roberto Lopez and Mike Micklebart also have a fact sheet on pH and EC (www.extension.purdue.edu/extmedia/HO/HO-237-W.pdf), which gives further details on the interpretation of results from the various monitoring techniques, as well as target ranges for various crops.
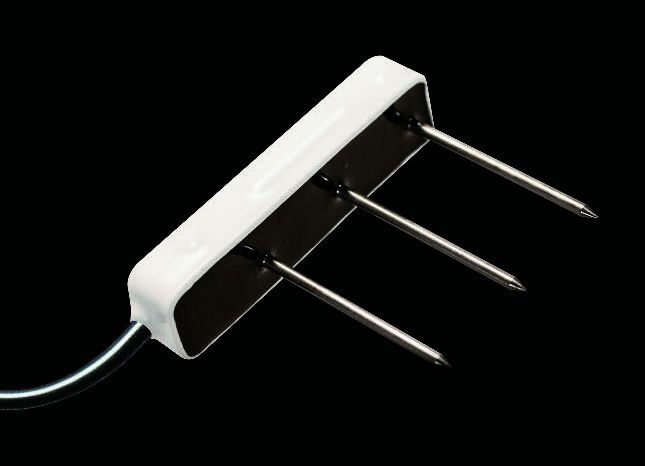
Figure 1. The GS3 EC Sensor (Decagon Devices, Inc.)
Given the labor (cost) and production implications for growers, we have been working hard to develop new ways to measure EC in the root zone to provide real-time data to growers. This article will provide some insight into those tools, which I believe will revolutionize the way we gather, collect and interpret this information.
A Few Facts
Measuring EC with sensors has been a proven technology for a long time, and there are a number of sensors (both handheld and in-line) that do a very good job of measuring EC, as long as that sensor is placed in an aqueous solution. I’m sure many of you have both a pH and EC sensor in your pump-house, monitoring your nutrients in-line just after your nutrient injector. This is perfect, because that EC sensor gives you baseline data on your nutrient concentrations which you can correlate to your various fertilizer sources.But once that nutrient solution is applied to a substrate, the EC changes rapidly for a number of reasons. Substrate particles and salts already present interact with the incoming nutrient solution. Nutrients can be adsorbed onto the surface of the substrate, and in the process, release other ions.
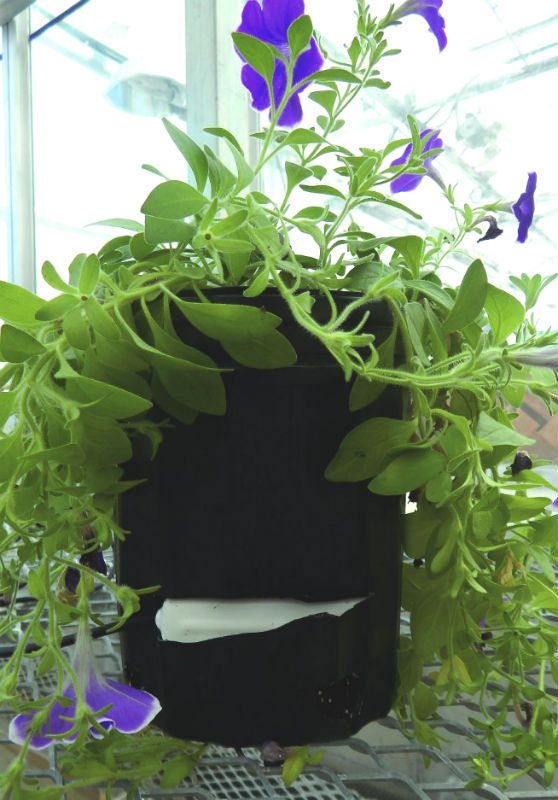
Figure 2: Placement of a GS3 sensor in the lower portion of a container.
Without getting too deep into soil chemistry, this is typically related to the cation and anionic exchange capacity of the substrate, which is often affected by the type of substrate. Plants also rapidly take up nutrients, sometimes with little or no interaction with the substrate. This is particularly true for nutrients supplied as anions, since few soilless media have any appreciable anion-exchange capacity. So that is why nitrate-nitrogen and phosphate, if applied in excess of container-capacity, are easily leached from the container.
As a reference, Holly Scoggins and Marc van Iersel compared the performance of number of EC sensors in a comprehensive study in 2006. This work demonstrated that many of these sensors worked well, but they concluded that these sensor readings should be correlated with existing techniques. That is still true, but during the last 10 years, the design of some sensors has been improved, and we now have the sensor network infrastructure to make this cost-effective and relatively easy for growers to implement. A key component of this capability has been the development of the software and integration of models used to gather and interpret the data. The data shown below was gathered using the GS3 sensor from Decagon Devices, Inc. This sensor, similar to the Delta-T Devices Wet-2 Sensor, was redesigned from previous versions, for use in more porous soilless substrates. This redesign had very important implications for providing consistent results in greenhouse production.
In practice, there are a few important considerations which you should do to provide good data from the GS3 sensor. It has three prongs (see Figure 1), which independently measure substrate water content, temperature, and EC. Since the sensor operates at 70 MHz frequency, this minimizes external salinity and soil/substrate texture effects. The stainless steel needles provide a greater surface area to optimize EC measurements, and also minimizes substrate disturbance during insertion. It is these features that increase the accuracy of this sensor, particularly if you are using it in soilless substrates with large particle sizes.
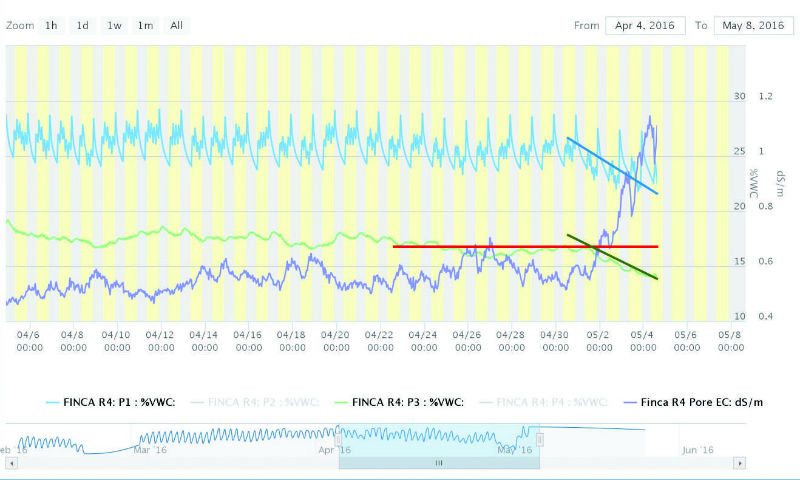
Figure 3: Too dry a substrate water content results in over-prediction of pore EC dynamics.
Differences Between Bulk EC and Pore Water EC
When a sensor is placed into a soil or substrate, it measures the “bulk” electrical conductivity of the soil, water and air surrounding that sensor. But plant roots actually take up salts and water from the free “pore” water between the substrate particles, which is not the same as bulk EC. So pore water values are calculated from bulk EC and water content using the Hilhorst model, using computations in the software. The bottom line is that pore water EC gives a much better approximation of the actual EC that plant roots experience. You can also double-check these values by knowing the actual EC of the nutrient solution you apply. Typically, these values are close.Sensor Placement
Since the GS3 sensor uses the water content of the substrate in this calculation of pore water EC, it is important that this sensor does not become too dry. To avoid this happening, we typically place the sensor in the lower quarter of the container, by cutting a horizontal slot in the side of the pot and inserting the sensor snugly into the media, as shown in Figure 2.This is typically the wetter portion of any container, and where one would naturally want to measure EC dynamics, to understand nutrient leaching and loss. As you can see, the sensor is small enough to measure quart containers, but not for containers less than this volume.
Once the sensor is placed in a container, one can measure continuous changes in pore water EC by choosing the pore water growing tool in either Decagon’s Datatrac software, or using third-party software (such as Sensorweb, Mayim, LLC), as illustrated in Figures 3 and 4. In this case, I have chosen a relatively simple dataset, where the light blue lines is the volumetric water content (VWC in percent) from a 10HS sensor placed a 4-inch depth in the root zone, whereas the light green and purple lines are VWC and pore water EC (in dS/m) measured at 8 inches below the root zone by the GS3 sensor. These plants were being constantly fertigated at 75- ppm nitrogen, which maintained a relatively constant EC of ± 0.55 dS/m in the lower part of the root zone. In this particular case, the data were measured every 15 minutes.
Figure 3 shows that the substrate moisture is maintained at an average of about 27 percent VWC by 3 to 4 pulse irrigations every day until May 1, when a reduction in irrigation frequency caused a decline in average VWC to about 23 percent by the May 4 (this trend indicated by the solid blue line). The GS3 VWC content also showed a decline (green line), whereas the pore water EC increased sharply from an average of about 0.6 to over 1.1 dS/m. The red line represents the minimum VWC recommended for the GS3 sensor in this particular substrate (about 17 percent VWC).
Figure 4 illustrates how the average VWC of the substrate increased at both depths, and the predicted pore water EC returned to normal, after the number of irrigations was increased starting on the May 5.

Figure 4: Restoration of normal substrate moisture returns the pore EC dynamics to normal.
A Simple Example Highlights Interesting Facts
First, the precise measurement of real-time pore water EC in substrates is now easy and cost- effective, given the time and effort involved with other measurement methods. However, one does have to be careful about misinterpreting the EC data if the VWC becomes too dry — but this threshold is probably drier than most growers would keep a container substrate anyway. If the EC increases when your substrate moisture is adequate (and your leaching fraction is not excessive), this probably indicates that your fertilization regime is in excess of immediate plant requirements and salts are building up in the substrate. Remember that for most crops, a substrate EC of 1.5 to 2.0 dS/m is excessive.Secondly, and perhaps more importantly for growers who are using slow-release formulations in outdoor production, monitoring your EC not only will help you monitor for sudden increases in salinity when hot weather occurs, but also help you monitor when nutrient levels decrease below acceptable levels — typically long before you see any deficiency symptoms or a slow- down in growth.
Lastly, good software should give you the capability to set threshold (warning) levels for any type of sensor output (including EC) — and the system will then automatically text or email you when those thresholds are exceeded. This is probably one of the most powerful features of using good tools — they work for you, to save you time and money.
John Lea-Cox is professor of nursery research and Extension specialist at University’s of Maryland department of plant science and landscape architecture. He can be reached at jlc@umd.edu.